Tracing as label propagation on a digraph
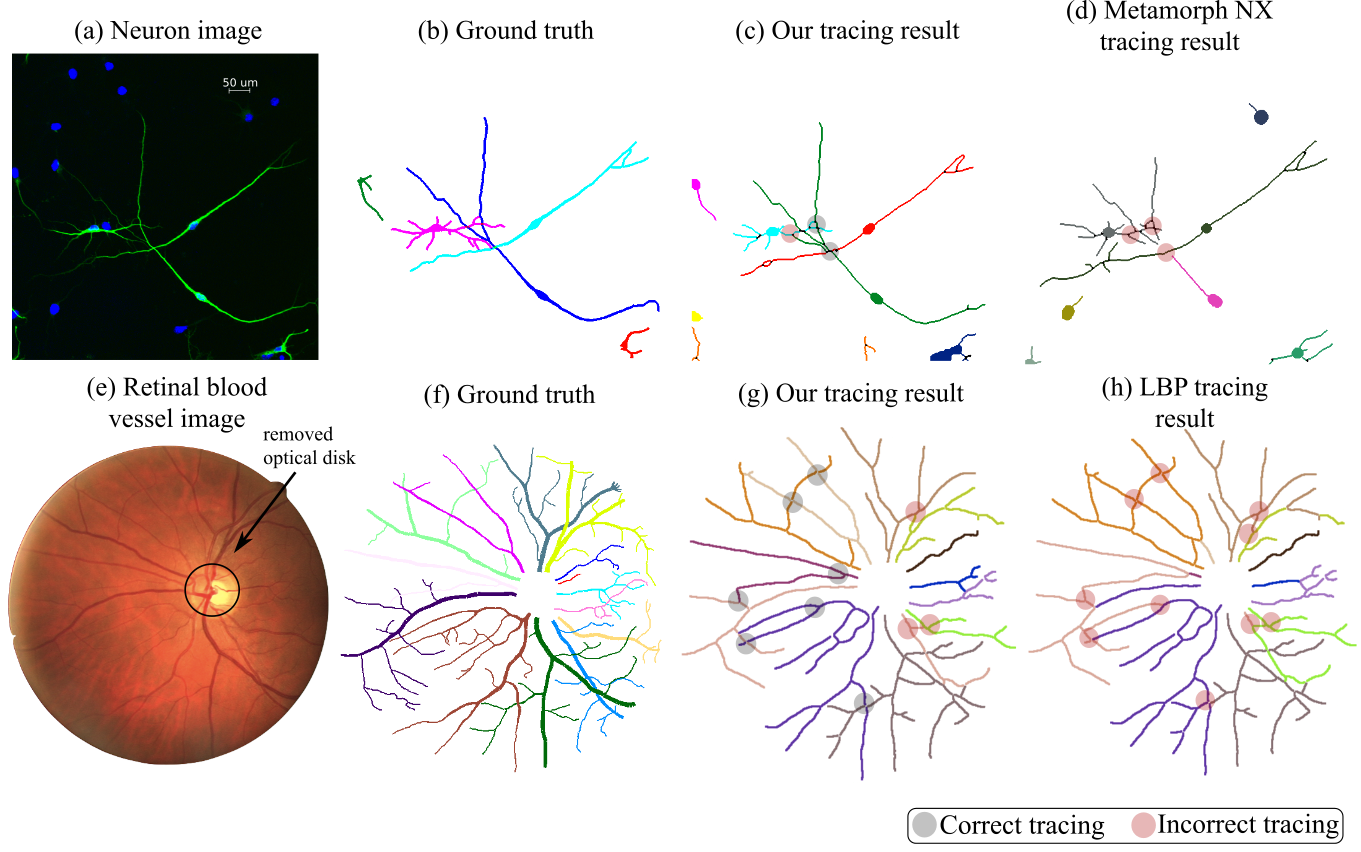
Our project aims at tracing filamentary structures in both neuronal and retinal images.
It is often crucial to identify single neurons in neuronal networks, or separate vessel tree structures in retinal blood vessel networks, in applications such as drug screening for neurological disorders or computer-aided diagnosis of diabetic retinopathy.
Both tasks are challenging as the same bottleneck issue of filament crossovers is commonly encountered, which essentially hinders the ability of existing systems to conduct large-scale drug screening or practical clinical usage.
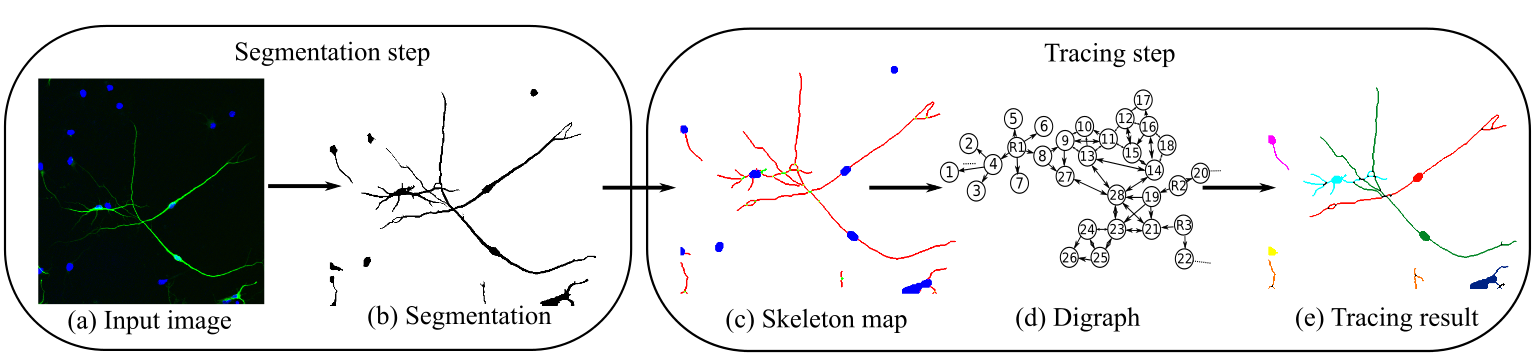
Here we consider a two-step tracing approach that takes into account both local and global contextual information of
the neuronal and the vessel network:
The first step takes the raw image as input and produces a pixel-based segmentation map.
After skeleton extraction, a novel graph representation is formed in the second step,
where each filament in the skeleton map becomes a node,
and a contact between two adjacent filaments could be translated to directed edges of these two nodes.
Furthermore, the root nodes are naturally identified as either the DAPI tagged soma (aka cell body) in neuronal images, or the filaments touching the optic disk area in fundus images, and are further labeled with their unique IDs.
The number of subgraphs to-be-found in the filamentary network thus equals the number of root nodes.
This naturally gives rise to a directed graph (or interchangeably, digraph) representation.
%
The tracing problem is now formulated as label propagation on digraphs:
The goal becomes that of propagating the subgraph labels from known root nodes to the rest of the digraph,
such that the digraph is partitioned into disjoint sub-graphs, which in turn delivers tracing result of the filamentary network. A series of techniques have been developed in our project to tackle this core problem, including in particular the MFTD method from the established matrix-forest theorem studied in algebraic digraph theory.
|
Empirical experiments are carried out on the following datasets.
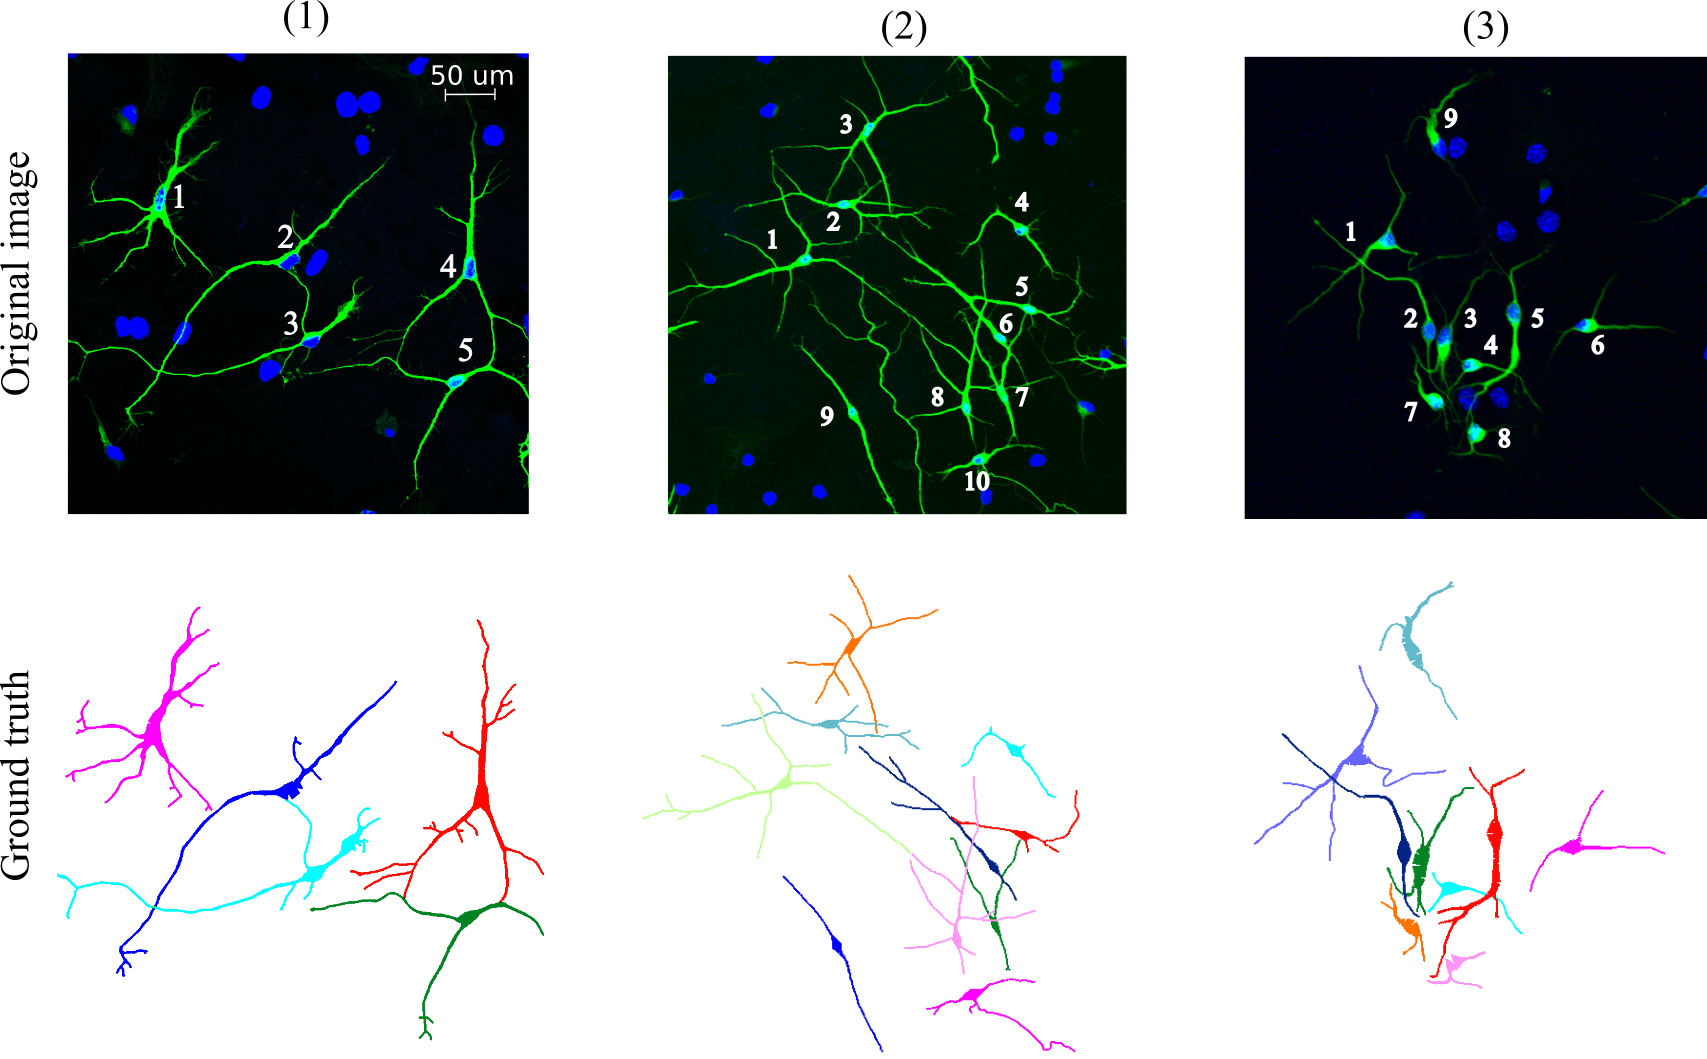
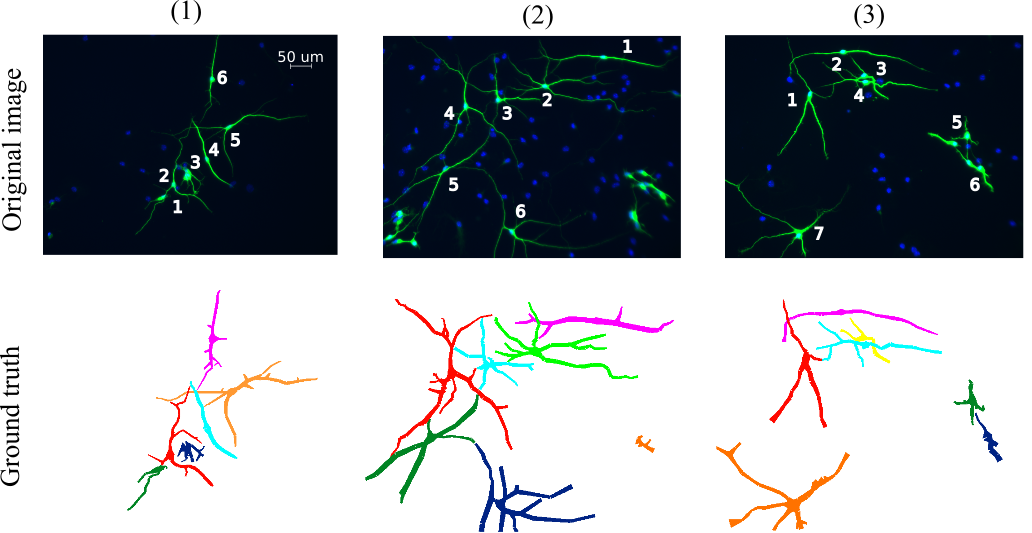
2D Neuronal image datasets (NeuB1 and NeuB2):
In collaboration with Institute of Medical Biology and Institute of Molecular and Cell Biology of A*STAR, we have collected and annotated hundreds of 2D neuronal images. Neurons are grown in-vitro from embryonic stem cells
and they are stained with two markers, one for neurite channel (GFP) and another one for nuclei channel (DAPI).
Furthermore, two microscopic imaging systems are used:
The first is an Olympus Fluoview FV1000 laser scanning confocal microscope, while the second is an Olympus lx-83 live-cell inverted with Coolsnap HQ2 camera. Both are with with a magnification of 20x. Note to evaluate the robustness of the tracers, two image resolutions are used in NeuB2: For a subset of 30 image, the resolution is set to 0.333 micrometer per pixel, while for the rest 68 images, it is set to 0.994 micrometer per pixel.
In practice, two batches of neurons are cultured, with NeuB1 of 112 images acquired with the first microscope, and NeuB2 of 98
images obtained using the second microscope.
It is worth noting that images of the second batch are more challenging, with more noticeable background noises and more blurred foregrounds. It nevertheless contributes to our dataset with added variability, which we feel could be very helpful to examine the reliability of the tracing systems.
Datasets and ground-truth
annotations can be downloaded from here. Several exemplary images are shown below.
-
Neuron dataset batch 1 (neuB1) :
-
Neuron dataset batch 2 (neuB2) :
Retinal blood vessel datasets:
DRIVE:
This dataset is from Image Science Institute, Netherlands. For detailed description of the dataset please refer to their dedicated webpage. Here we provide our manually annotated ".swc" tracing files that can be used as the tracing ground truths.
STARE:
This dataset is from National Institutes of Health, United States. For detailed description of the dataset please refer to their webpage. Here we provide our manually annotated ".swc" tracing files that can be used as the tracing ground truths.
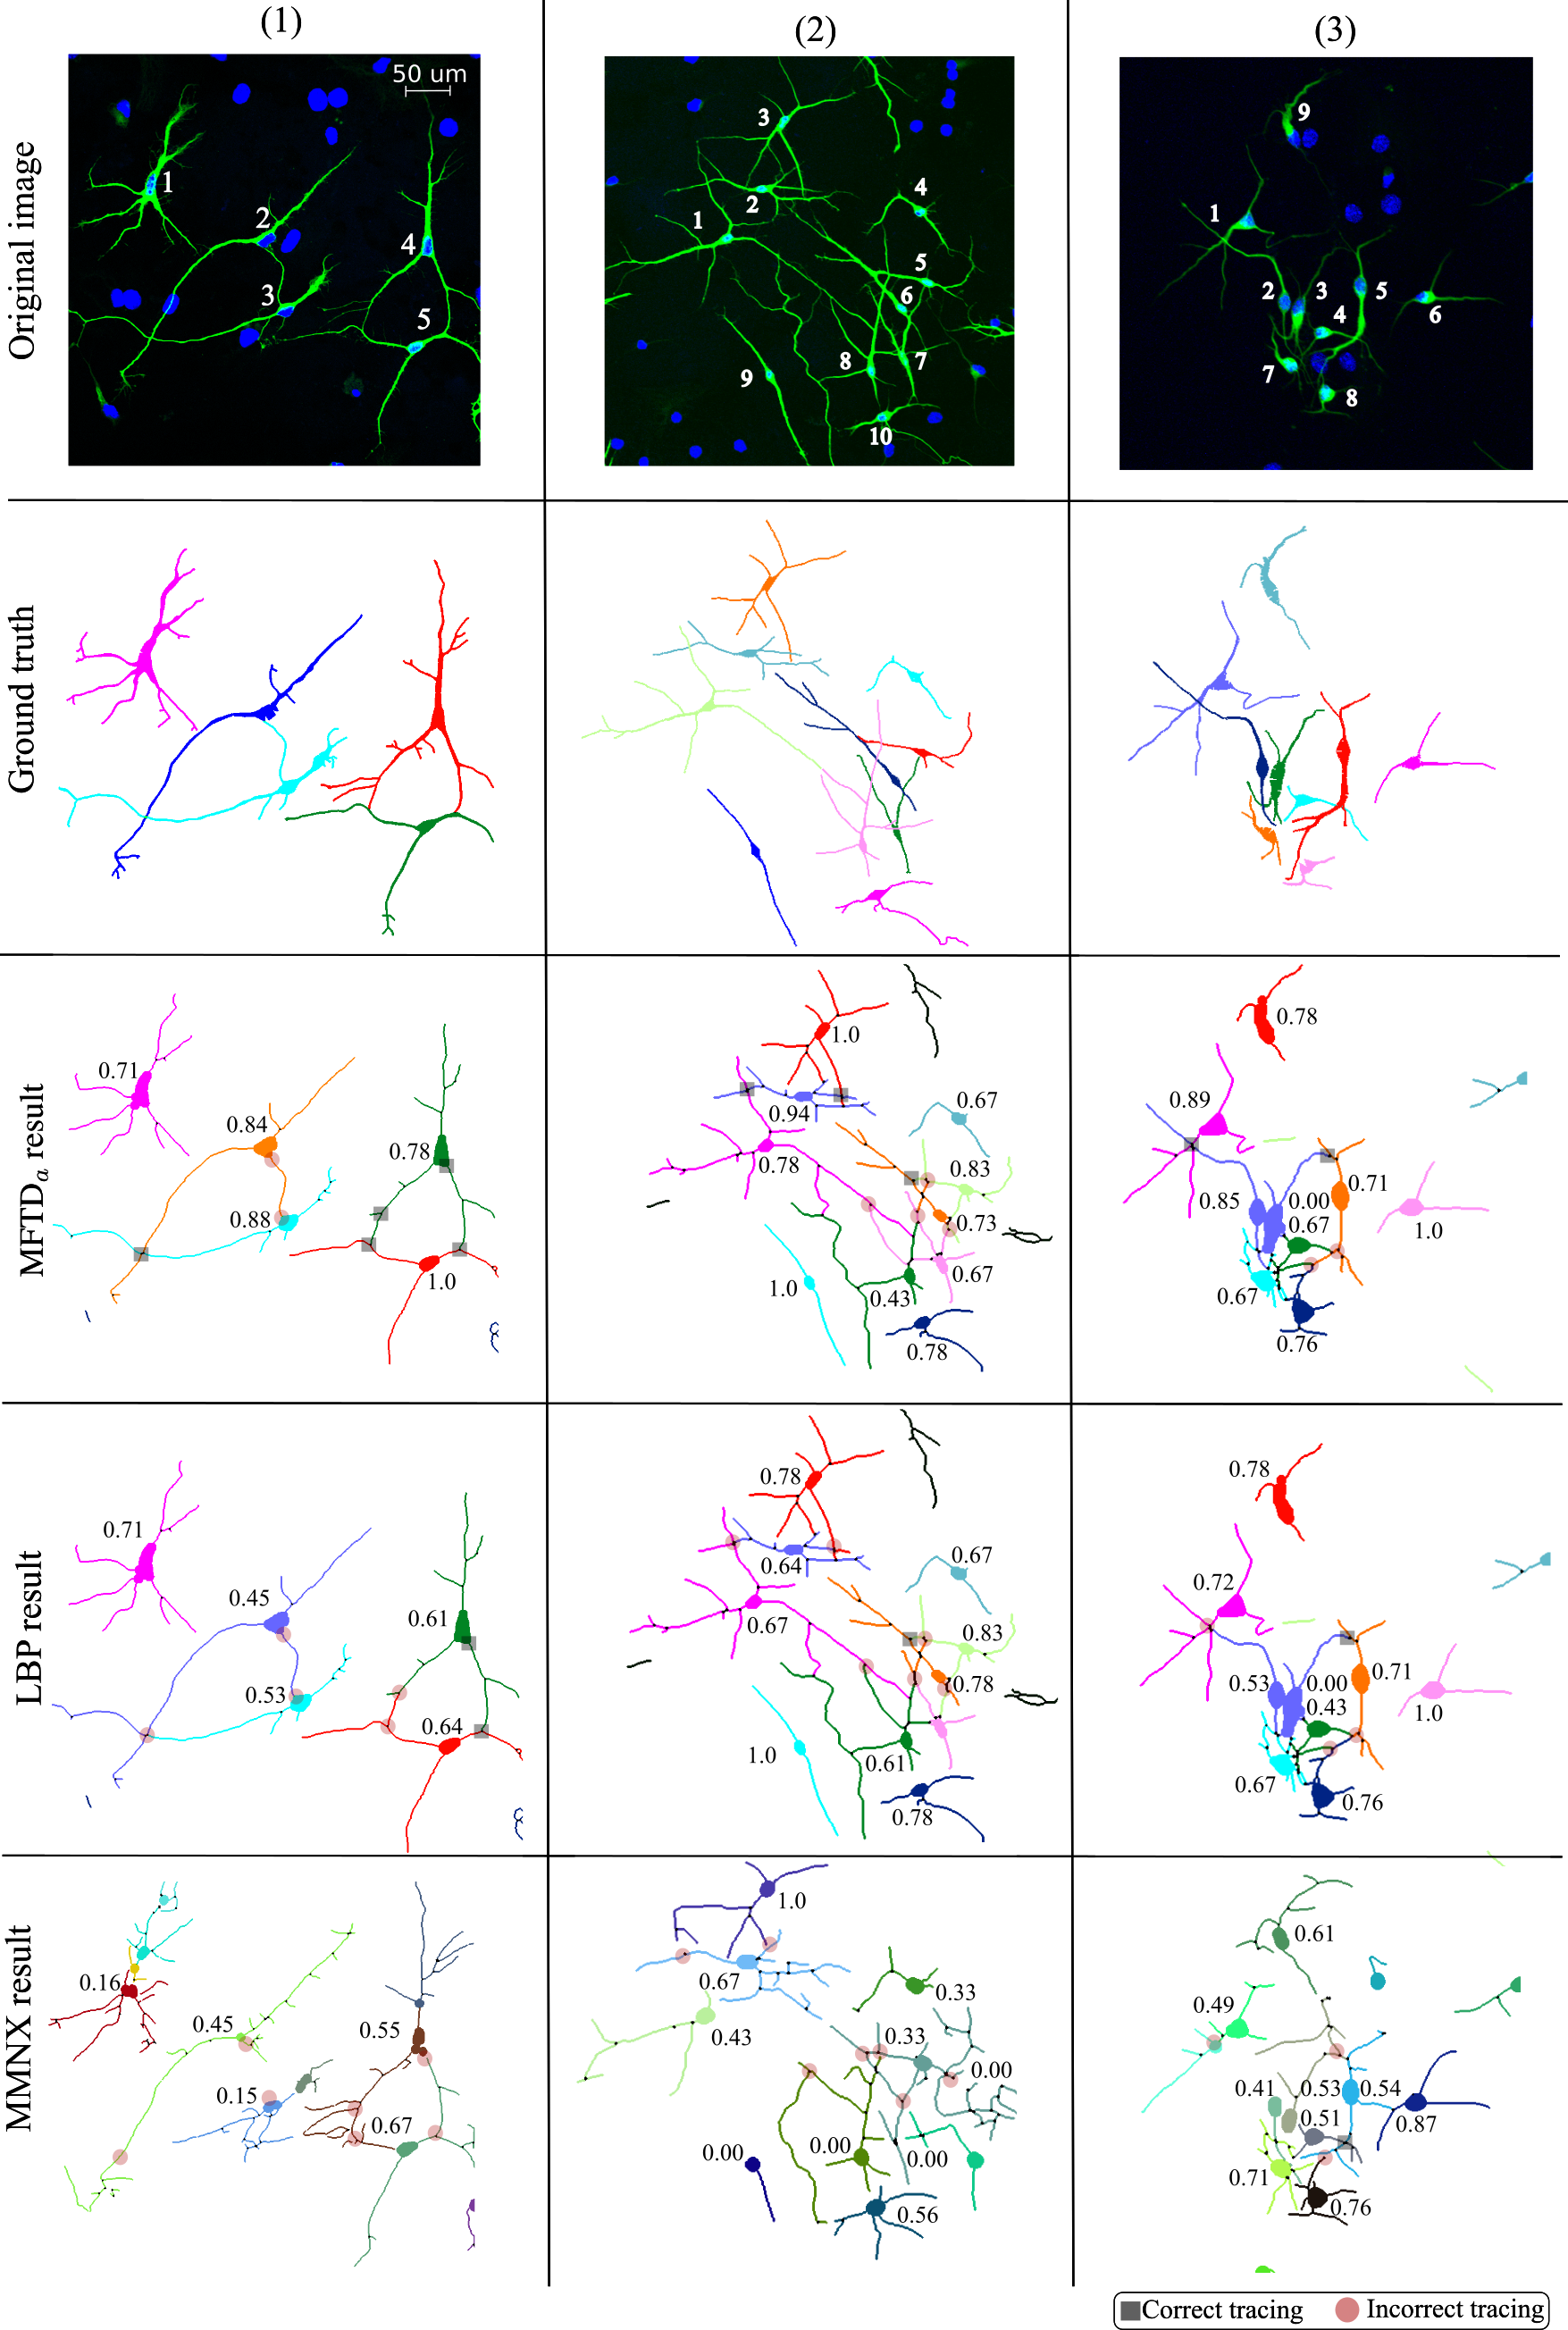
- DIADEM Score:
We have adopted DIADEM Metric from the DIADEM Challenge to evaluate the performance of our approaches. The MATLAB code to convert a traced image file to DIADEM metric compatible ".swc" file is provided here, with detailed description in [2].
- Our methods : MFTDa, MFTDb, MFTDc, MFTDd.
- Comparison methods that work based on our segmentation results from the first step : SGL, ZFL, LLGC, MF, TRW, LBP.
- Comparison methods that are entirely based on their own: MMNX (Metamerph NX from Molecular Devices) and NC (Neurocyto).
See the reference tab for more details.
Table for DIADEM score comparison
| | MFTDa | MFTDb | MFTDc | MFTDd | SGL | ZFL | LLGC | MF | TRW | LBP | MMNX | NC |
| NeuB1 | 0.52 | 0.51 | 0.51 | 0.41 | 0.45 | 0.47 | 0.50 | 0.38 | 0.46 | 0.42 | 0.43 | 0.36 |
| NeuB2 | 0.26 | 0.24 | 0.25 | 0.19 | 0.21 | 0.22 | 0.21 | 0.15 | 0.23 | 0.19 | 0.22 | 0.14 |
| DRIVE | 0.79 | 0.76 | 0.75 | 0.63 | 0.68 | 0.73 | 0.71 | 0.58 | 0.68 | 0.63 | - | - |
| STARE | 0.42 | 0.41 | 0.42 | 0.26 | 0.35 | 0.39 | 0.38 | 0.29 | 0.35 | 0.32 | - | - |
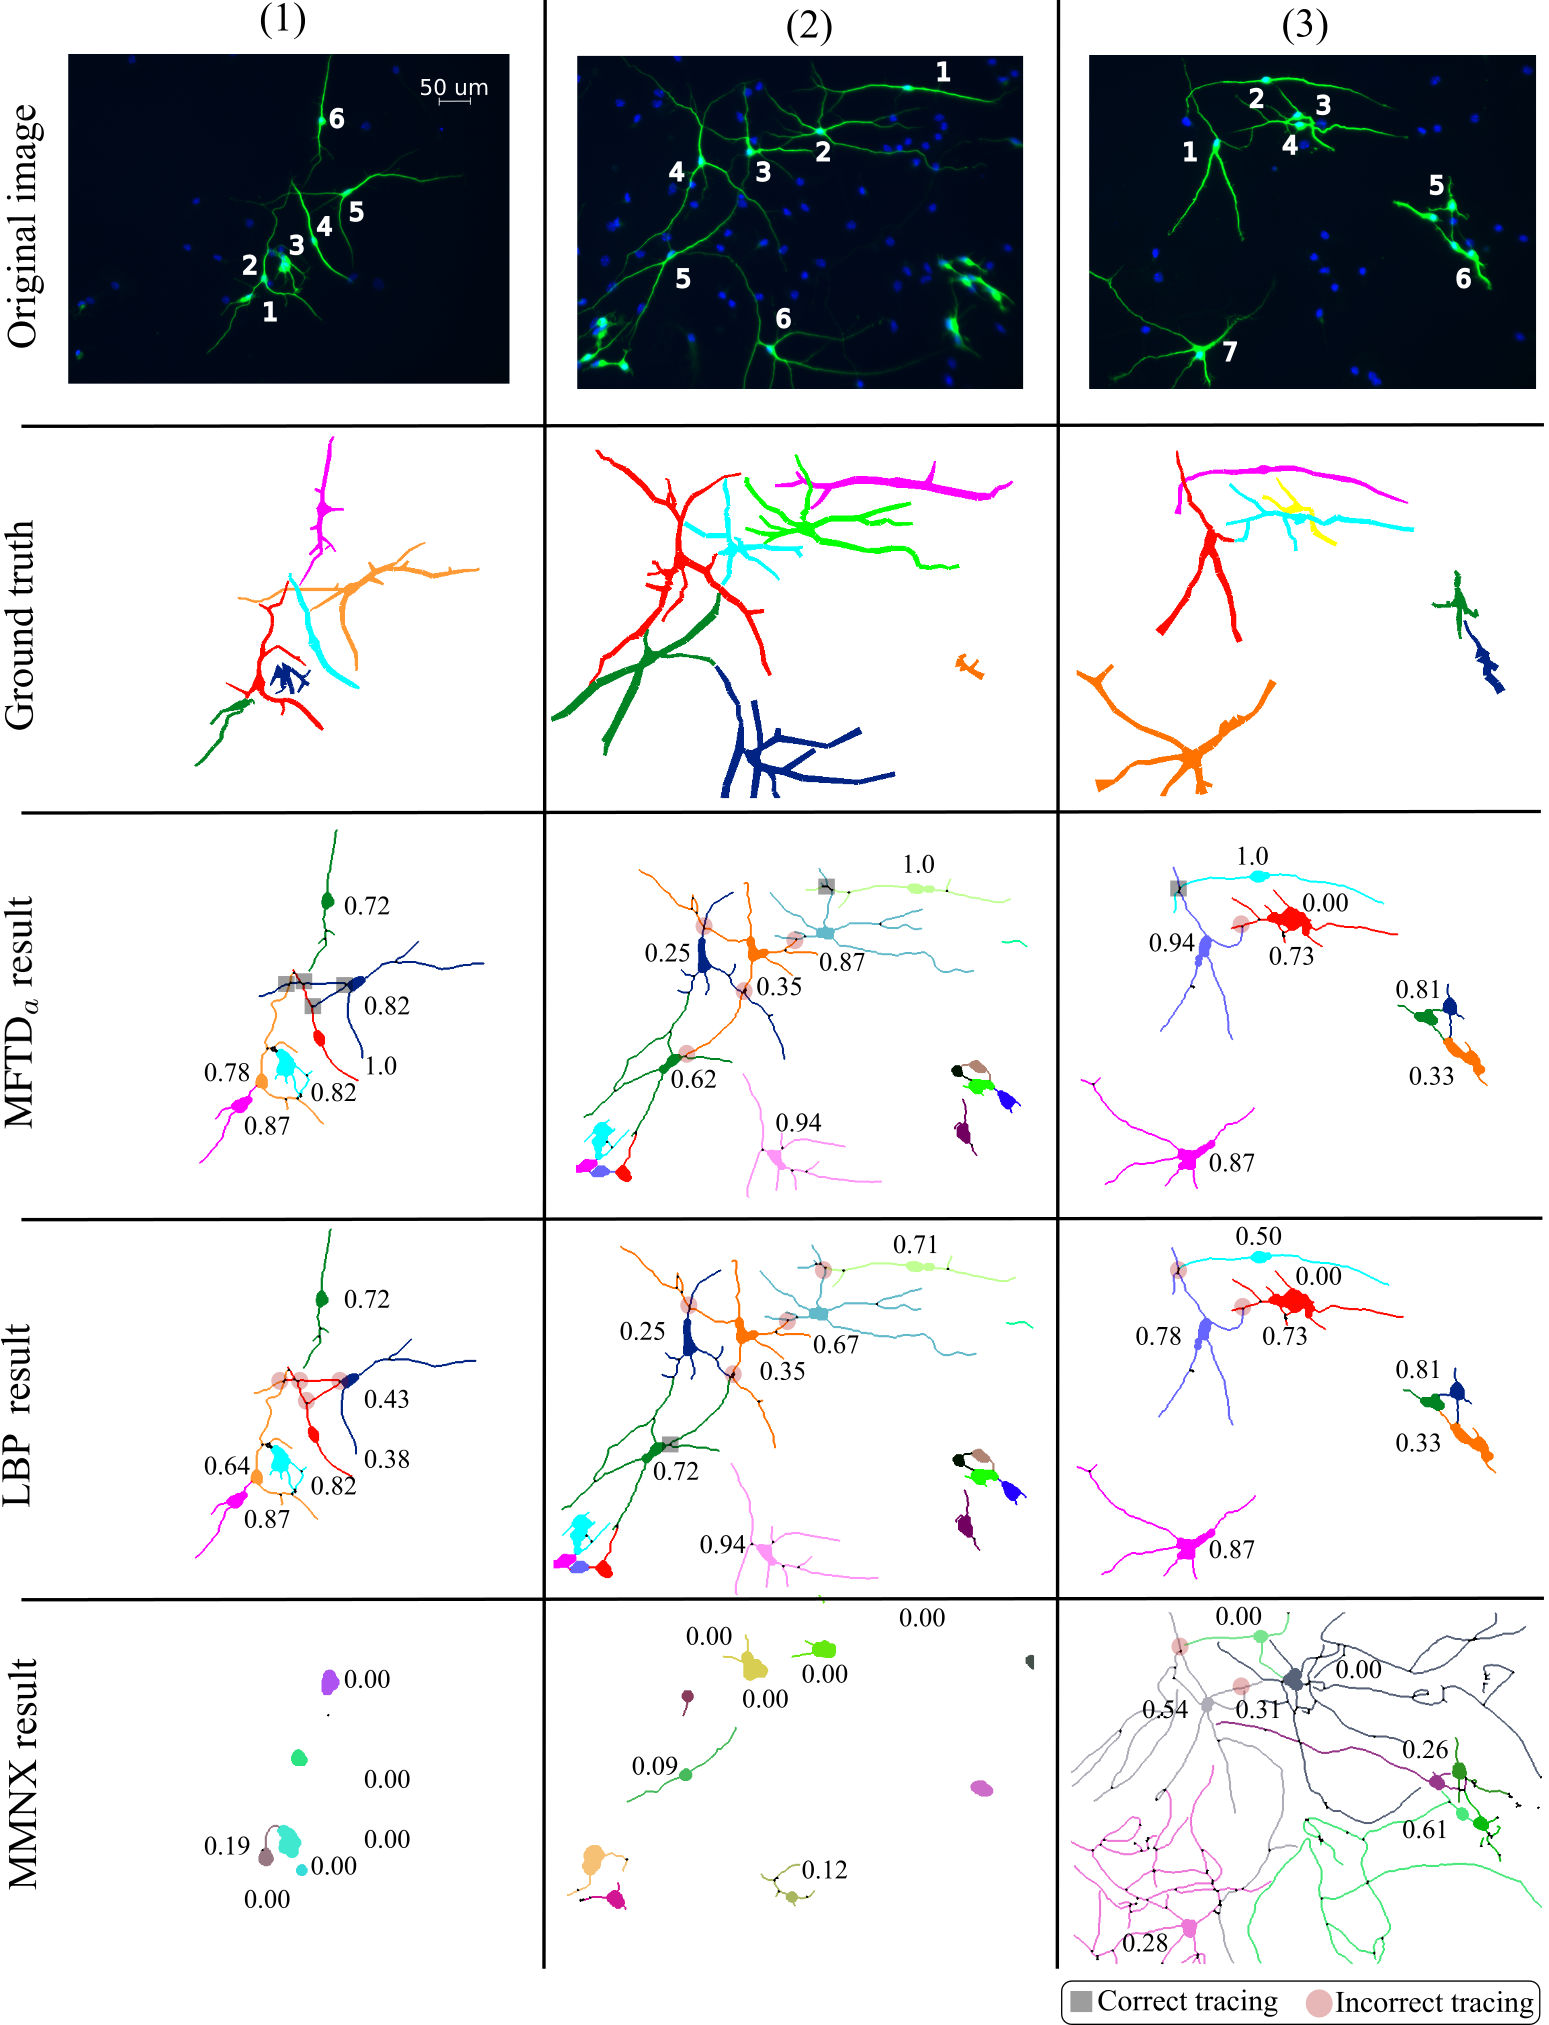
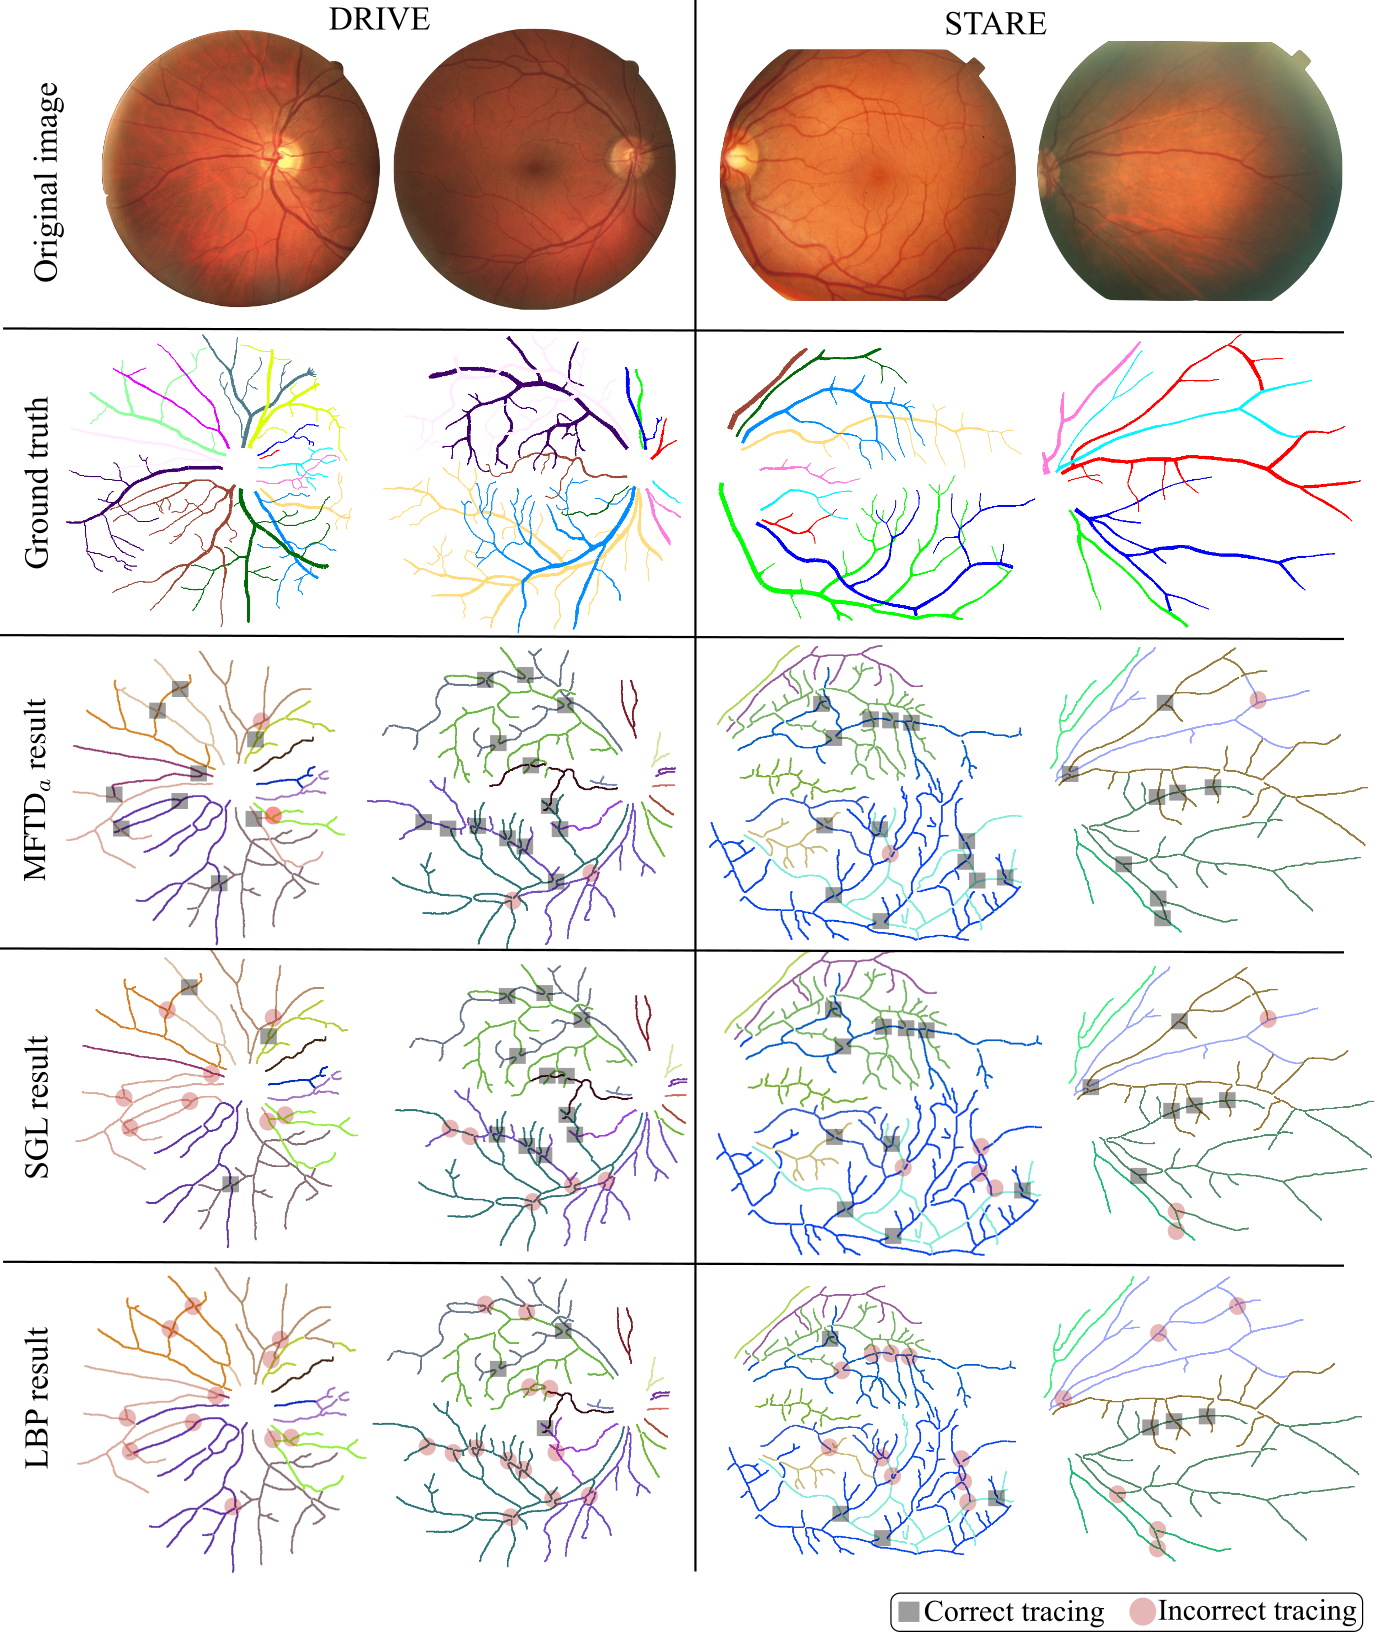
Visual examples
NeuB1
NeuB2
Retina
- Jaydeep De, Li Cheng, Xiaowei Zhang, Feng Lin, Huiqi Li, Kok Haur Ong, and Weimiao Yu. A Graph-theoretical Approach for Tracing Filamentary Structures in Neuronal and Retinal Images. In IEEE Transactions on Medical Imaging, In Press, 2015. [pdf]
- Li Cheng, Jaydeep De, Xiaowei Zhang, Feng Lin, and Huiqi Li Tracing Retinal Blood Vessels by Matrix-Forest
Theorem of Directed Graphs. In MICCAI, 2014.[pdf]
- Jaydeep De, Huiqi Li, Li Cheng. Tracing retinal vessel trees by transductive inference. In BMC Bioinformatics, 15(20):1–20, 2014. [pdf]
- Jaydeep De, Tengfei Ma, Huiqi Li, Manoranjan Dash, Li Cheng. Automated Tracing of Retinal Blood Vessels Using Graphical Models. In 18th Scandinavian Conference on Image Analysis, Espoo, Finland, June, 2013. [pdf]
References
- SGL : Symetrized graph laplacian. D. Zhou, J. Huang, and B. Scholkopf, “Learning from labeled and unlabeled data on a directed graph,” in ICML, 2005.
- ZFL : Zero-mode free laplacian. H. Wang, C. Ding, and H. Huang, “Directed graph learning via high-order co-linkage analysis,” in ECML, 2010.
- LLGC : Learning with local and global consistency method. D. Zhou, O. Bousquet, T. Lal, J. Weston, and B. Scholkopf, “Learning with local and global consistency,” in NIPS, 2004.
- MF, TRW, LBP : Mean field, Tree reweighted, Loopy belief propagation inference method of graphical model. M. Wainwright and M. Jordan, Graphical models, exponential families, and variational inference, ser. Foundations and trends in machine learning. Hanover: Now Publisher, 2008.
- Neurocyto : W. Yu, H. Lee, s. Hariharan, W. Bu, and S. Ahmed, “Quantitative neurite outgrowth measurement based on image segmentation with topological dependence,” Cytometry Part A, vol. 75A, no. 4, pp. 289–297, 2009.